最近我使用OpenCv做研究,發現C#在這領域蠻缺乏資源的,在找怎麼畫出直方圖時花了一些時間,所以現在來分享一下結果。
Recently I was using OpenCV to do research, found C# in this field was quite lack of resources, looking for how to draw the histogram took me some time, so now to share the results.
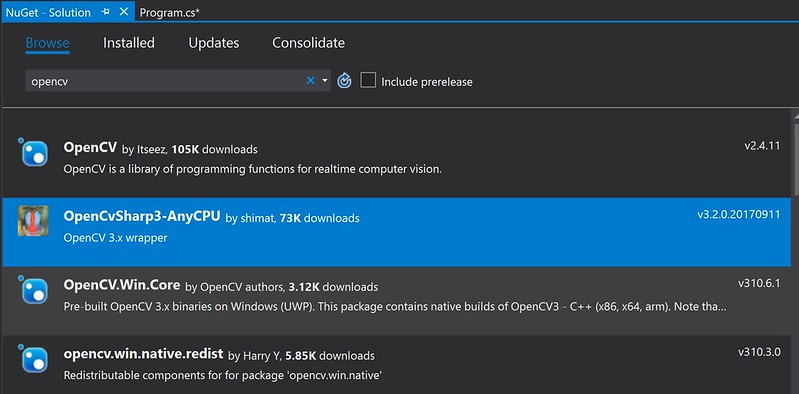
首先,使用nuget安裝OpenCvSharp,目前C#比較好用的OpenCv Wrapper。
First, use nuget to install OpenCvSharp, the current better OpenCv Wrapper for C#.
然後參考下列程式碼
Then refer to the following code
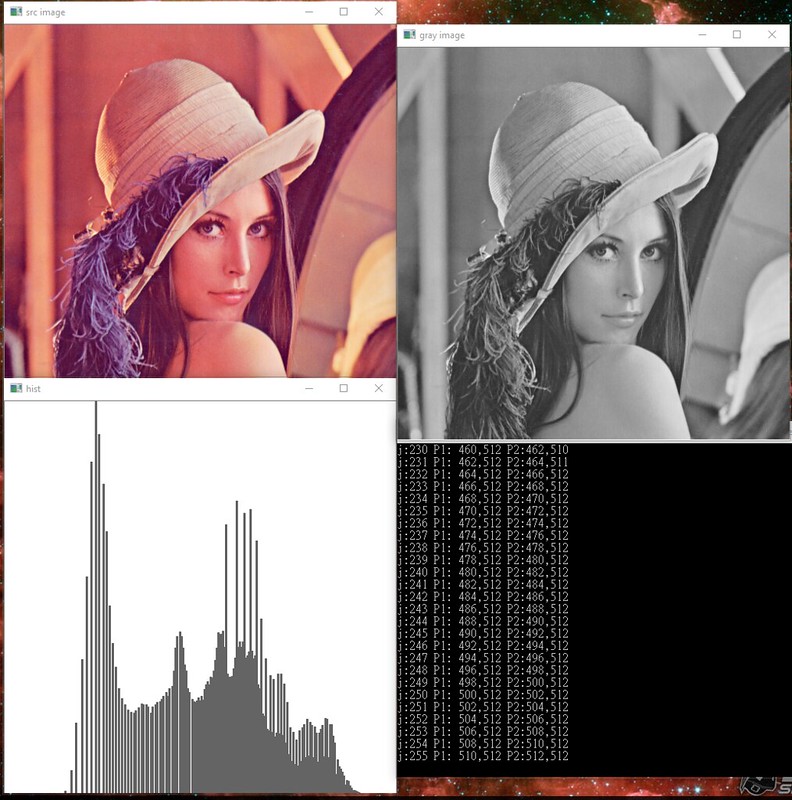
其執行結果如下
The results are as follows
Hope you enjoy it.
Recently I was using OpenCV to do research, found C# in this field was quite lack of resources, looking for how to draw the histogram took me some time, so now to share the results.
首先,使用nuget安裝OpenCvSharp,目前C#比較好用的OpenCv Wrapper。
First, use nuget to install OpenCvSharp, the current better OpenCv Wrapper for C#.
然後參考下列程式碼
Then refer to the following code
using System;
using OpenCvSharp;

namespace GetHistogramExample
{
    class Program
    {
        static void Main()
        {
            string file = "Lenna.png";
            Mat src = new Mat(file);
            Mat gray = new Mat(file, ImreadModes.GrayScale);
            Mat hist = GetHistogram(gray);
            using (new Window("src image", src))
            using (new Window("gray image", gray))
            using (new Window("hist", hist))
            {
                Cv2.WaitKey();
            }
        }

        // Draw Histogram from source image - for gray
        public static Mat GetHistogram(Mat source)
        {
            Mat hist = new Mat();
            int width = source.Cols, height = source.Rows;      // set Histogram same size as source image
            const int histogramSize = 256;                      // you can change by urself
            int[] dimensions = { histogramSize };               // Histogram size for each dimension
            Rangef[] ranges = { new Rangef(0, histogramSize) }; // min/max

            Cv2.CalcHist(
                images: new[] { source },
                channels: new[] { 0 }, //The channel (dim) to be measured. In this case it is just the intensity (each array is single-channel) so we just write 0.
                mask: null,
                hist: hist,
                dims: 1, //The histogram dimensionality.
                histSize: dimensions,
                ranges: ranges);

            Mat render = new Mat(new Size(width, height), MatType.CV_8UC3, Scalar.All(255));
            double minVal, maxVal;
            Cv2.MinMaxLoc(hist, out minVal, out maxVal);
            Scalar color = Scalar.All(100);
            // Scales and draws histogram
            hist = hist * (maxVal != 0 ? height / maxVal : 0.0);
            int binW = width / dimensions[0];
            for (int j = 0; j < dimensions[0]; ++j)
            {
                Console.WriteLine($@"j:{j} P1: {j * binW},{render.Rows} P2:{(j + 1) * binW},{render.Rows - (int)hist.Get(j)}");  //for Debug
                render.Rectangle(
                    new Point(j * binW, render.Rows - (int)hist.Get(j)),
                    new Point((j + 1) * binW, render.Rows),
                    color,
                    -1);
            }
            return render;
        }
    }
}
其執行結果如下
The results are as follows
Hope you enjoy it.

No comments:
Post a Comment